Price action is one of the cleanest, simplest, and most powerful ways to trade the financial markets. Whether you’re a beginner or an experienced trader, price action gives you clarity by stripping away complicated indicators and focusing on the only thing that truly matters: price itself.
In this article, we’ll break down what price action really is, how it works, and how traders use it successfully to make confident and informed decisions, without guessing, stressing, or overcomplicating the process.
What Is Price Action? (In Simple Words)
Price action refers to the natural movement of price on a chart. Instead of using 5–10 indicators that can slow you down and confuse your mind, price action helps you study:
- Candlesticks
- Market structure
- Trends
- Support and resistance
- Patterns
- Buyer vs. seller strength
You are basically reading the story the market is telling you, directly from the chart, without any “filters.”
If indicators are like wearing sunglasses, price action is seeing the market with your bare eyes.
This is why price action is often called the purest form of technical analysis.
Core Components of Price Action
To use price action successfully, you must understand the main building blocks that form the structure of the market. Let’s break them down.
1. Candlestick Patterns:
Candlesticks represent the emotions of buyers and sellers. Every candle has a message.
Some powerful candlestick patterns include:
• Pin Bar (Rejection Candle)
Shows strong rejection at a price level, signals potential reversal.
• Engulfing Candle:
A large candle engulfing the previous candle signals a power shift.
• Doji:
Market indecision is a possible trend change or continuation.
• Inside Bar:
Price is consolidating, or a breakout may come soon.
These patterns help traders judge whether the market wants to rise, fall, or pause.
2. Support and Resistance Levels:
Support and resistance levels are the foundation of price action trading.
• Support:
A price zone where buyers consistently step in.
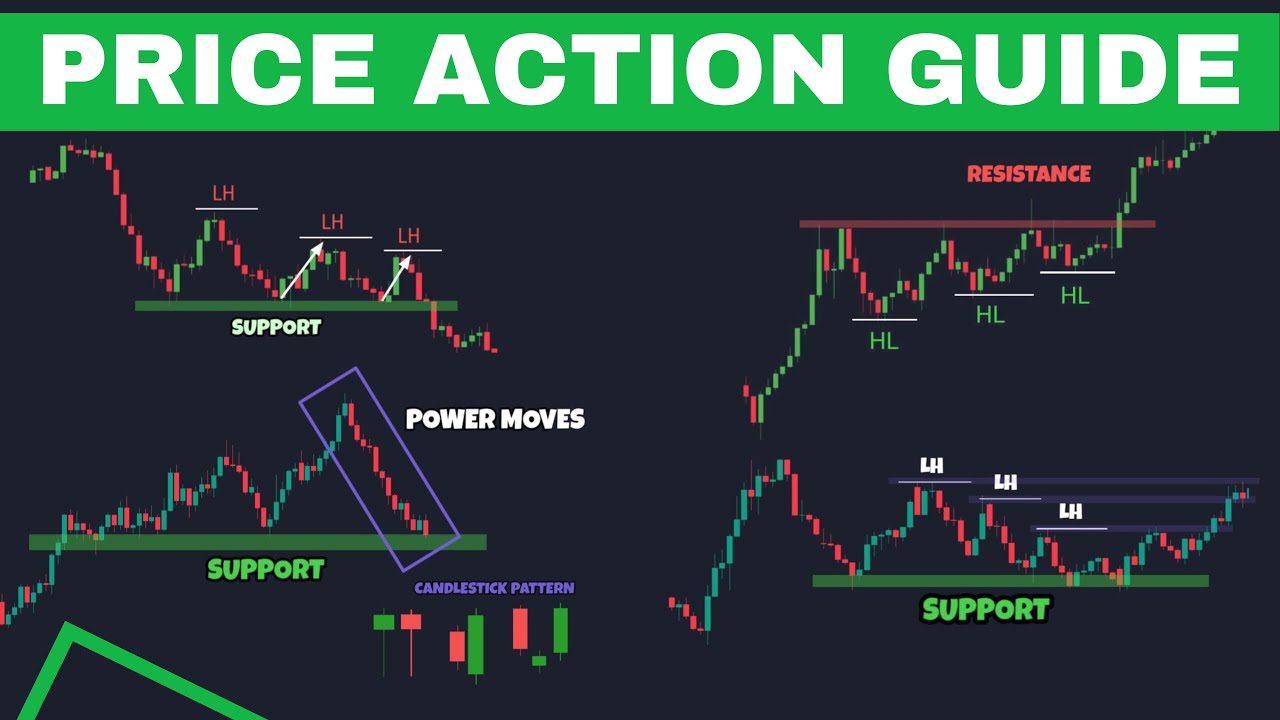
• Resistance:
A zone where sellers take control.
These levels show where:
- Market reversals may happen
- Breakouts may occur
- Traders place entries and exits
Support and resistance act like “traffic signals” on the chart, telling you when to slow down, stop, or prepare to move.
3. Trends and Market Structure:
Price action traders always start by identifying the trend:
- Uptrend: Higher highs, higher lows
- Downtrend: Lower highs, lower lows
- Range: Price stuck between support and resistance
Market structure gives the roadmap for price movement. It helps you understand where the price is coming from and where it may go next.
A tip used by professionals:
Trade with the trend until the trend clearly ends.
4. Breakouts and Fakeouts:
Breakouts happen when the price moves above resistance or below support.
But here’s the tricky part:
Not every breakout is real. Some are “fakeouts” that trap traders.
Price action helps identify:
- Genuine breakouts
- False breakouts
- Break-and-retest setups
These setups are some of the most profitable for traders when done right.
5. Key Price Action Patterns:
Price action charts form patterns that repeat across time, markets, and timeframes.
Some useful ones include:
- Double Top / Double Bottom
- Head and Shoulders
- Triangle patterns
- Flags and pennants
- Wedges
These patterns help traders anticipate the next move before it happens.
Conclusion:
Price action trading is all about clarity, simplicity, and confidence. Instead of relying on noisy indicators or guessing the market’s next move, price action helps you read the market directly, like understanding body language without needing words.
When you learn price action, you’re not just learning a strategy; you’re learning how the market thinks, how traders behave, and how momentum builds and shifts.
If you stay patient and keep practicing, you’ll find that price action becomes your most reliable trading partner, one that never lies.